
Most Business Owners Either Track Nothing or Track the Wrong Things
If someone asked you right now whether your website is working — really working, generating calls and inquiries — could you answer with confidence?
Most small business owners can’t. They either have no tracking set up at all and are guessing based on gut feel, or they check a vanity metric like total page views and assume that means everything is fine.
Neither approach tells you what you actually need to know: whether your website is helping your business grow.
Website performance tracking doesn’t need to be complicated. It needs to be focused on the right questions. Is your site getting found? Is it getting clicked? Are visitors taking action when they arrive? This guide explains exactly what to measure, which tools to use, and how to read the data in plain language — without needing a background in analytics.
What “Website Performance” Actually Means
Website performance is not a single number. It is a combination of four distinct things:
Visibility — Can people find your website on Google? This is measured through search impressions, keyword rankings, and how often your site appears in results.
Traffic — Are people actually clicking through to your website? This is measured through organic clicks, sessions, and users.
Engagement — When people arrive, are they doing anything? Are they reading, navigating to other pages, or leaving immediately?
Conversions — Are visitors taking the actions that matter to your business — calling, filling out a form, requesting a quote?
A website can score well on one of these and fail on the others. You can have strong visibility but poor click-through rates — meaning your listing appears but nobody clicks. You can have decent traffic but no conversions — meaning visitors arrive and leave without contacting you. Understanding which of these is the weak link tells you where to focus.
Traffic, Rankings, and Leads: Understanding the Difference
These three things are related but independent — and confusing them leads to bad decisions.
Rankings are where your pages appear in Google search results for specific searches. Ranking on page one for “plumber Ottawa” is meaningful. Ranking on page one for a search nobody makes is not. Rankings tell you about visibility, not about whether anyone is taking action.
Traffic is how many people actually visit your website. You can have strong rankings and weak traffic if your page titles and meta descriptions don’t encourage clicks. You can have decent traffic from social media or direct visits even with weak SEO rankings.
Leads are the actual business outcome — calls, form submissions, quote requests. You can have high traffic and generate almost no leads if your website messaging is unclear, your call to action is hidden, or the experience on mobile is poor.
The goal of tracking is to understand where the breakdown is. High rankings, low traffic — fix your titles and meta descriptions. High traffic, low leads — fix your conversion design. Low rankings — fix your SEO. Each problem has a different solution.
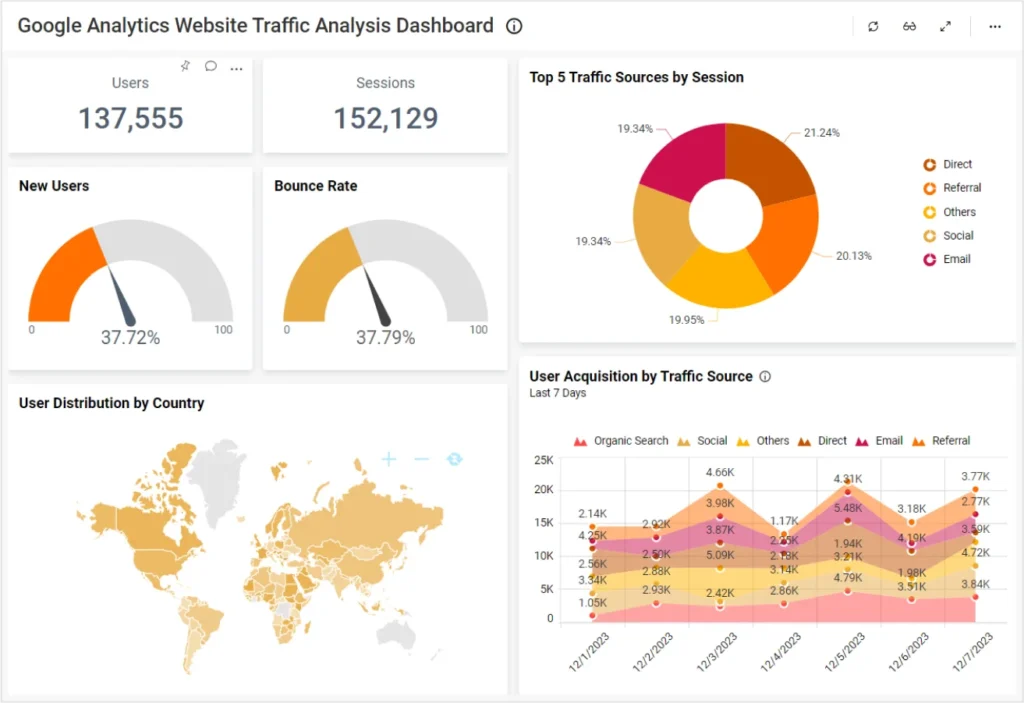
Google Analytics shows you what happens when people arrive on your website — how many visited, how long they stayed, which pages they looked at, and whether they completed any conversion actions.
The Two Tools That Actually Matter for Small Businesses
There are dozens of analytics tools available. For most Ottawa small businesses, two free tools from Google cover everything you need to know.
Google Analytics 4
Google Analytics (now GA4) tracks what happens on your website after someone arrives. It tells you:
- How many people visited your site in a given period (users and sessions)
- Where those visitors came from — Google search, direct URL, social media, or referral links
- Which pages they landed on and which ones they visited after
- How long they stayed and how many pages they viewed
- Whether they completed any actions you’ve set up as conversions (form submissions, phone number clicks, button clicks)
For small business owners, the most important reports in GA4 are the Acquisition report (where traffic comes from), the Engagement report (which pages get the most attention), and the Conversions report (if you’ve set up goal tracking).
Setting up GA4 is free and takes about thirty minutes. Google’s Analytics Help Centre provides step-by-step guidance. If your website is on WordPress, plugins like MonsterInsights or Site Kit by Google simplify the setup significantly.
Google Search Console
Search Console tracks what happens before someone visits your website — how often your pages appear in Google search results and what people do when they see your listing.
It tells you:
- Impressions — How many times your pages appeared in Google search results
- Clicks — How many times someone clicked through to your site
- Click-through rate (CTR) — What percentage of impressions turned into clicks
- Average position — Where your pages ranked on average for the searches that triggered them
- Which search queries — The actual words people typed that caused your site to appear
Search Console also shows technical information: which pages are indexed, which have errors, and whether Google is having trouble accessing any part of your site.
For small businesses, the Performance report in Search Console is where you spend most of your time — it shows your search visibility data and helps you identify which pages and keywords are gaining or losing ground over time.
Setting up Search Console is free and requires verifying ownership of your domain. Submit your sitemap through Search Console once set up to help Google index your pages efficiently. Full guidance is available at Google Search Console Help.
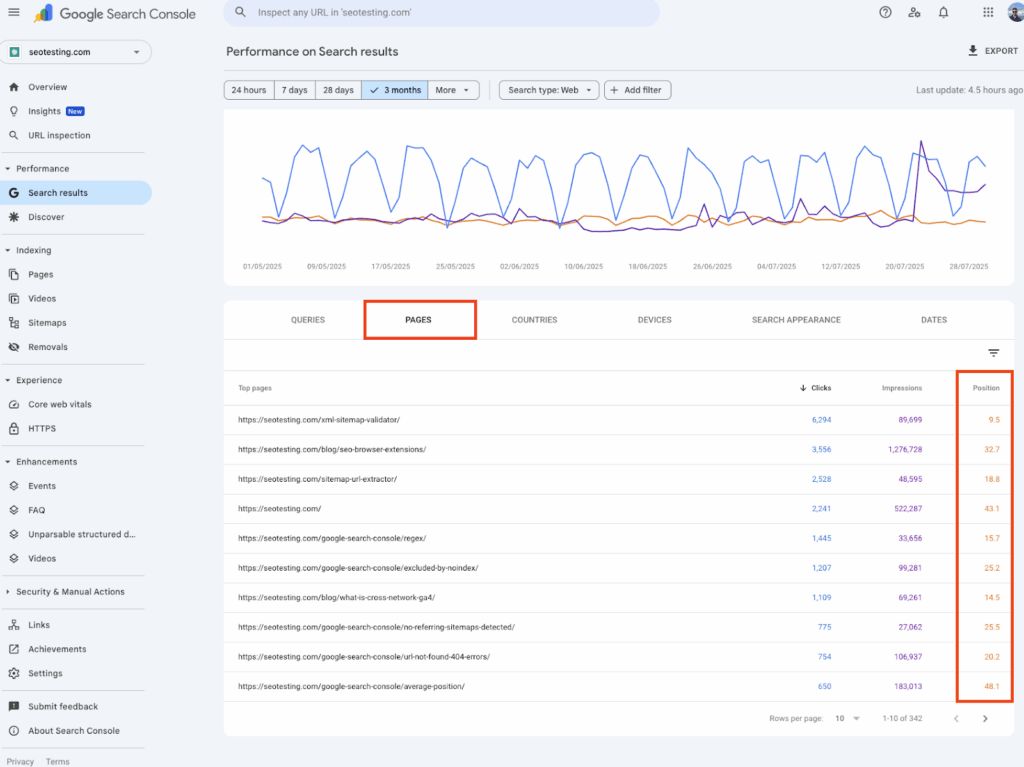
Google Search Console shows what happens before your site gets clicked — how often your pages appear in search, what queries trigger them, and where they rank on average.
GA4 vs. Search Console: Which Does What
These two tools are complementary, not interchangeable. A common source of confusion is thinking one replaces the other.
| What you want to know | Use this tool |
|---|---|
| How many people visited my site | Google Analytics |
| Where my traffic came from | Google Analytics |
| Which pages people visited | Google Analytics |
| Whether visitors took action | Google Analytics |
| How often my site appears on Google | Search Console |
| What searches trigger my pages | Search Console |
| What my average ranking position is | Search Console |
| Whether Google can index my pages | Search Console |
| Technical crawl errors | Search Console |
Use both. They answer different questions and together give you a complete picture of your site’s performance.
Speed and Mobile Performance: The Technical Layer
Beyond traffic and conversions, website speed and mobile experience affect both how visitors behave and how Google ranks your pages.
A website that takes five seconds to load on mobile loses a significant percentage of visitors before they read a word. Google also uses Core Web Vitals — a set of speed and user experience metrics — as a ranking factor. A slow site ranks lower than a faster competitor with equivalent content.
Test your site’s speed and Core Web Vitals at Google PageSpeed Insights. You’ll receive a score out of 100 for both mobile and desktop, with specific recommendations. A mobile score below 50 is actively hurting both your traffic and your conversion rate.
Common causes of poor performance: uncompressed images, too many third-party scripts, unoptimised hosting, and excess plugin load on WordPress sites.
Conversion Tracking: The Most Important Setup Most Sites Skip
Traffic data without conversion data tells only half the story. For a local service business, the conversions that matter are phone calls, contact form submissions, quote requests, and booking completions.
Without conversion tracking, you cannot tell whether a visitor who arrived from a Google search for “plumber Barrhaven” called your business, bounced after ten seconds, or spent five minutes reading your services page before leaving. All three look the same in your session count.
Setting up basic conversion tracking in GA4:
- Form submissions: GA4 can automatically detect form submissions on most platforms, or you can configure enhanced measurement to track them specifically
- Phone number clicks: Configure phone number links as click events so mobile taps are tracked
- Button clicks: Track “Get a Quote” or “Book a Consultation” button clicks as conversion events
If you use a CRM or booking system, most integrate with GA4 and can pass completed booking data back as conversions.
Once conversion tracking is in place, you can see not just how many people visited, but how many of those visits resulted in a business inquiry — and which traffic sources, pages, and search queries are generating the most valuable visitors.
For a detailed look at why many Ottawa websites get traffic but don’t generate leads, our post on how to get more clients from your website identifies the most common conversion problems and how to fix them.
What Metrics Actually Matter for Local Service Businesses
Not all metrics are equally useful. For a local service business in Ottawa, these are the ones worth monitoring monthly:
From Search Console:
- Total clicks (organic) — trending up, flat, or declining?
- Total impressions — are more searches triggering your site?
- Average CTR — are people clicking when they see your listing?
- Average position for your key service searches — improving over time?
- Top queries — what are people actually searching to find you?
From Google Analytics:
- Organic sessions — traffic specifically from Google search
- Top landing pages — which pages are people entering on first?
- Engagement rate — what percentage of visitors engage meaningfully vs. bounce immediately?
- Conversions — form submissions, phone clicks, quote requests (requires setup)
- Pages with high drop-off — where are people leaving your site?
Technical:
- PageSpeed score — checked quarterly or after major site changes
- Core Web Vitals status — checked in Search Console under Experience
What to ignore (or deprioritize):
- Raw page views without context — a single page viewed 10,000 times means nothing if nobody converts
- Social media followers and likes — not a website performance metric
- Keyword rankings for searches that don’t reflect your actual business searches
How to Tell Whether the Problem Is Traffic, Conversion, or Both
This is the most practical diagnostic question in website performance — and it shapes every decision about where to focus improvement efforts.
You have a traffic problem if:
- Your Search Console shows fewer than 100 clicks per month from organic search
- Your impressions are very low — meaning your pages rarely appear in results
- Your top-ranking keywords are for searches with no real search volume
You have a conversion problem if:
- Your site gets reasonable traffic but generates very few calls or form submissions
- Your engagement rate is low — people arrive and leave immediately
- Your top pages have no clear call to action or visible contact information
You have both if:
- Traffic is low and the traffic you do receive rarely converts
- Your Search Console shows searches with low average position AND your GA4 shows high bounce rates on landing pages
Fixing the wrong problem wastes both time and money. Spending on SEO to drive more traffic into a site that doesn’t convert produces proportionally more disappointment, not more leads. Fix conversion first — then scale traffic. Our guide on how to improve your website’s SEO covers where to start when the issue is on the visibility side.

Conversion tracking is what connects your website traffic data to real business outcomes — without it, you can see how many people visited but not how many actually contacted you.
Common Website Tracking Mistakes Small Businesses Make
Tracking nothing at all. A surprisingly common situation — the website was built, launched, and never connected to any analytics. If this is you, setting up Search Console and GA4 is the most important next step.
Checking traffic without context. “We got 500 visitors this month” tells you almost nothing on its own. The useful questions are: where did they come from, which pages did they visit, and how many contacted you?
Focusing on vanity metrics. Total page views, social media referrals, and time-on-site can all look healthy while the site generates zero leads. Tie your tracking to metrics that connect to actual business inquiry activity.
Not comparing periods. Looking at one week of data tells you very little. Compare month-over-month and year-over-year to see meaningful trends. A drop in February traffic is normal for most businesses — the question is whether February this year is better or worse than February last year.
Ignoring mobile performance. Most local searches happen on phones. If you are only checking desktop analytics and not testing your mobile experience, you are missing where most of your traffic actually arrives and where the biggest drop-off is likely happening.
Setting up tracking but never looking at it. The value of analytics is in regular review and response. A monthly thirty-minute review of your Search Console and GA4 data is enough to catch problems early and identify what is working.
Your Monthly Website Tracking Checklist
Set a recurring calendar appointment — thirty minutes, once a month — and work through this in order:
Google Search Console:
- Total clicks this month vs last month and same month last year
- Total impressions — growing or declining?
- Average CTR — above 3% is reasonable for most local service searches
- Average position for your top five service keywords
- Top queries — any new searches driving traffic worth optimizing for?
- Coverage report — any new indexing errors or excluded pages?
Google Analytics:
- Organic sessions this month vs previous periods
- Top five landing pages by sessions
- Engagement rate on top landing pages
- Conversion events completed (form submissions, phone clicks, bookings)
- Sessions with 0% engagement — which pages are losing people fastest?
- Traffic sources — is organic growing relative to direct and social?
Technical:
- PageSpeed Insights score on homepage and top service page (quarterly)
- Core Web Vitals status in Search Console (quarterly)
Google Business Profile (complements website tracking):
- Profile views, website clicks, and calls from GBP this month
- Review count and average rating change
Frequently Asked Questions
Do I need Google Analytics and Google Search Console, or just one?
Both — they answer different questions. Search Console tells you what happens in Google search before someone visits your site: how often you appear, what searches trigger your pages, and where you rank. GA4 tells you what happens after someone arrives: which pages they visit, how long they stay, and whether they complete any actions. Using only one gives you half the picture. Setup for both is free and takes under an hour combined.
What is a good amount of website traffic for a small local business?
This varies significantly by industry, location, and how competitive your local market is. A realistic benchmark for a well-optimized Ottawa small business website is 200–500 organic sessions per month from Google search, with a 2–5% conversion rate producing 4–25 leads monthly. A trades business in a competitive Ottawa market might see 300 sessions per month and generate 15 calls. What matters more than absolute volume is the trend — consistent month-over-month growth in both traffic and conversions indicates the strategy is working.
How do I set up conversion tracking on my website?
In GA4, go to Admin → Events → and look for automatically detected events like form_submit or click. For phone number links, ensure they are formatted as tel: links so mobile taps register as click events. For more reliable conversion tracking across all form types, tools like Google Tag Manager give you precise control without requiring a developer for most setups. Google’s Analytics Help Centre has step-by-step guides for each approach.
How do I know if my Search Console data is telling me something is wrong?
Watch for: impressions dropping significantly month-over-month (your pages are appearing less in search), average position rising sharply (you are moving down in rankings), CTR falling below 2% on your main service pages (your titles and descriptions aren’t compelling clicks), or the Coverage report showing a sudden increase in “Excluded” or “Error” pages (Google can’t access parts of your site). Any one of these warrants investigation. For a practical guide to diagnosing SEO issues, our post on why your website might not be showing up on Google covers the diagnostic process step by step.
What is bounce rate and should I worry about it?
In GA4, the equivalent metric is “engagement rate” — the percentage of sessions where users engaged meaningfully with the page (scrolled significantly, clicked something, or visited a second page). A low engagement rate on a key service page — below 40% — suggests visitors are arriving and leaving without finding what they were looking for. This could indicate a mismatch between what the search query promised and what the page delivered, a slow load time, or a poor mobile experience. Context matters: a contact page with a high exit rate is expected. A service page with a high exit rate and no conversions is a problem worth investigating.
How often should I check my website analytics?
For most small businesses, monthly is sufficient. Set a recurring reminder, spend thirty minutes reviewing the checklist above, and note any significant changes from the previous month. Checking daily creates anxiety without actionable insight — website data needs time to show meaningful trends. Check more frequently (weekly) if you’ve recently made significant changes to a page, updated your SEO settings, or launched a new service page — to track whether the changes are having the expected effect.
Track What Matters, Ignore What Doesn’t
Website analytics is not about collecting more data. It is about asking the right questions and having the tools to answer them.
Is your site appearing in Google searches? Are those appearances turning into clicks? Are those clicks turning into calls, form submissions, and quote requests? Those three questions — answered monthly with ten minutes in Search Console and twenty minutes in GA4 — give you everything you need to make informed decisions about your website and your SEO.
If the answers reveal a gap — too few impressions, too few clicks, too few conversions — the data tells you exactly where to focus next. And if the data tells you things are improving month after month, you have concrete evidence that the investment in your website and local SEO is working.
At Ottawa Web Genius, we help Ottawa small businesses understand what their website is actually doing — and what to fix next. Whether that’s improving technical performance, strengthening service pages, or setting up the conversion tracking that makes all this data meaningful.
Explore our web design and SEO services to see how we approach website performance — or reach out if you’d like us to take a look at what your current data is telling you.